DataPlotGrid
DataPlotGrid class is a helper class for creating figures with multiple subplots aligned into a grid.
Its aim is to quickly redistribute multiple plots/values on a 2D grid and automatically calculate their corresponding indexes and grid coordinates.
In the example below, we redistribute 5 integers on a grid with 2 columns.
Note that values can be redistributed horizontally transpose=False or vertically transpose=True.
If the total number of grid cells exceeds the number of values, one can iterate over empty cells using missing=True property.
>>> from scinumtools import DataPlotGrid
>>> dpg = DataPlotGrid(list(range(5)), ncols=2)
>>> list(dpg.items())
[(0, 0, 0, 0), (1, 0, 1, 1), (2, 1, 0, 2), (3, 1, 1, 3), (4, 2, 0, 4)]
>>> list(dpg.items(missing=True))
[(5, 2, 1)]
>>> list(dpg.items(transpose=True))
[(0, 0, 0, 0), (1, 1, 0, 1), (2, 2, 0, 2), (3, 0, 1, 3), (4, 1, 1, 4)]
>>> list(dpg.items(transpose=True, missing=True))
[(5, 2, 1)]
The above example receives a list of values as an input, however, it is also possible to iterate over a dictionary of key/value pairs.
>>> dpg = snt.DataPlotGrid(dict(a=0, b=1, c=2, d=3, e=4), ncols=2)
>>> list(dpg.items())
[(0, 0, 0, 'a', 0), (1, 0, 1, 'b', 1), (2, 1, 0, 'c', 2), (3, 1, 1, 'd', 3), (4, 2, 0, 'e', 4)]
>>> list(dpg.items(missing=True))
[(5, 2, 1)]
>>> list(dpg.items(transpose=True))
[(0, 0, 0, 'a', 0), (1, 1, 0, 'b', 1), (2, 2, 0, 'c', 2), (3, 0, 1, 'd', 3), (4, 1, 1, 'e', 4)]
>>> list(dpg.items(transpose=True, missing=True))
[(5, 2, 1)]
Code below is an example how DataPlotGrid can be used in combination with Python’s matplotlib module.
Note that DataPlotGrid calculates automatically number of rows/columns and figure size required by the plt.subplots() method.
Size of individual plot axes can be set by axsize argument at DataPlotGrid initialization.
>>> from scinumtools import DataPlotGrid
>>> import matplotlib.pyplot as plt
>>>
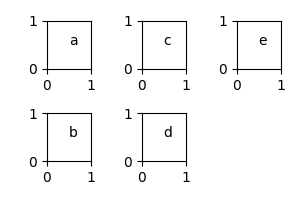
>>> dpg = DataPlotGrid(['a','b','c','d','e'],ncols=3,axsize=(1,1))
>>>
>>> fig, axes = plt.subplots(dpg.nrows, dpg.ncols, figsize=dpg.figsize, tight_layout=True)
>>> for i, m, n, v in dpg.items():
>>> ax = axes[m,n]
>>> ax.text(0.5, 0.5, v)
>>> for i, m, n in dpg.items(missing=True):
>>> ax = axes[m,n]
>>> ax.set_axis_off()
>>> plt.show()
On the corresponding figure, we can see, that number of values is smaller than the number of cells on the grid.
Therefore, we looped over the missing axes a removed from the figure.
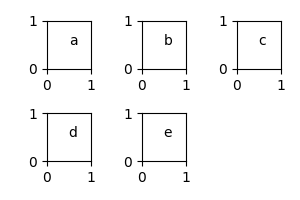
A transposed version of the same example is given below.
>>> fig, axes = plt.subplots(dpg.nrows, dpg.ncols, figsize=dpg.figsize, tight_layout=True)
>>> for i, m, n, v in dpg.items(transpose=True):
>>>     ax = axes[m,n]
>>>     ax.text(0.5, 0.5, v)
>>> for i, m, n in dpg.items(transpose=True, missing=True):
>>>     ax = axes[m,n]
>>>     ax.set_axis_off()
>>> plt.show()